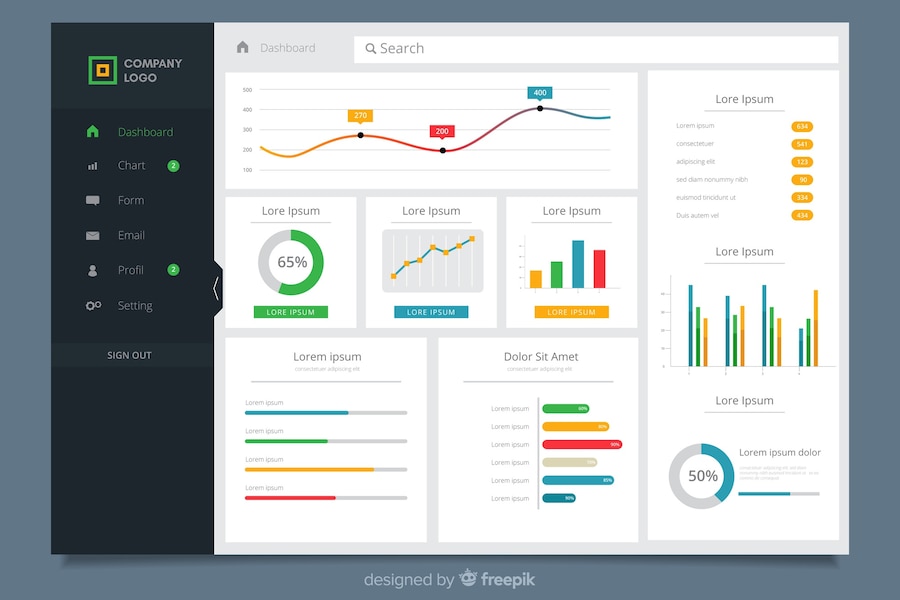
Power BI evolved as a vital tool in the dynamic world of business intelligence, enabling firms to get useful insights from their data. Power BI has revolutionized data visualization with its straightforward interface and comprehensive functionality, allowing users to create interactive and visually attractive dashboards. As we approach 2023, the demand for effective data representations grows, and Power BI dashboard examples become more diversified and sophisticated. In this blog, we will look at ten of the greatest Power BI dashboard examples for 2023, each of which offers distinct insights and serves as inspiration for enterprises in a variety of industries.
Top Power BI Dashboard Ideas that are the Most Powerful Examples
1. Sales Performance Dashboard
The Sales Performance Dashboard is a quintessential example of how Power BI can transform raw sales data into a comprehensive and actionable overview. With visually appealing charts, graphs, and KPIs, this dashboard allows sales managers to track revenue, monitor sales team performance, identify top-selling products, and analyze customer trends. By having access to real-time data, sales leaders can make informed decisions, optimize strategies, and drive revenue growth.
2. Marketing Campaign Dashboard
A well-executed marketing campaign is vital for any business, and the Marketing Campaign Dashboard helps marketers track the effectiveness of their efforts. With features such as conversion rates, click-through rates, and social media engagement metrics, this dashboard offers a bird’s-eye view of campaign performance. Armed with these insights, marketing teams can refine their campaigns, identify successful channels, and allocate resources more efficiently.
3. Financial Performance Dashboard
For financial analysts and CFOs, the Financial Performance Dashboard presents a comprehensive snapshot of a company’s financial health. It enables users to monitor key financial indicators, such as cash flow, profitability, and expenses, through dynamic visualizations. Additionally, this dashboard can be customized to integrate data from various sources, providing a holistic perspective on the organization’s financial performance.
4. Human Resources Analytics Dashboard
In the realm of human resources, data-driven decision-making has become paramount. The Human Resources Analytics Dashboard offers HR managers a comprehensive overview of employee data, including attrition rates, training progress, and workforce demographics. Leveraging these insights, HR teams can identify talent gaps, enhance employee satisfaction, and implement targeted retention strategies.
5. Supply Chain Management Dashboard
Efficient supply chain management is crucial for businesses seeking a competitive edge. The Supply Chain Management Dashboard empowers logistics and operations managers to optimize inventory levels, track shipment statuses, and identify potential bottlenecks. By visualizing the supply chain process, organizations can streamline operations, reduce costs, and improve overall efficiency.
6. Customer Experience Dashboard
Customer satisfaction is at the heart of any successful business. The Customer Experience Dashboard amalgamates customer feedback, sentiment analysis, and service response metrics to provide a comprehensive view of customer satisfaction levels. Armed with these insights, companies can enhance their products and services, address customer pain points, and foster brand loyalty.
7. Project Management Dashboard
Project managers juggle multiple tasks and deadlines, making a Project Management Dashboard invaluable for streamlining operations. This dashboard visualizes project progress, resource allocation, and task timelines, ensuring teams stay on track and meet deadlines effectively. Moreover, the ability to drill down into specific project details allows for swift issue resolution and resource reallocation.
8. Healthcare Analytics Dashboard
The Healthcare Analytics Dashboard is particularly relevant in the healthcare industry, where data-driven decisions impact patient outcomes. This dashboard aggregates patient data, treatment efficacy rates, and hospital performance metrics. Healthcare providers can leverage these insights to improve patient care, optimize resource allocation, and identify areas for medical research and innovation.
9. E-commerce Sales Dashboard
E-commerce businesses thrive on real-time data to stay ahead in the highly competitive online market. The E-commerce Sales Dashboard presents crucial metrics like sales by product, customer buying behavior, and cart abandonment rates. Armed with these insights, e-commerce managers can devise targeted marketing strategies, improve the customer experience, and boost overall sales.
10. Social Media Analytics Dashboard
The Social Media Analytics Dashboard caters to the ever-expanding social media landscape. It provides a comprehensive overview of social media performance, including audience demographics, engagement rates, and content reach. Armed with these insights, social media marketers can fine-tune their content strategies, improve brand presence, and drive user engagement.
Conclusion
As we embark on a new year, the significance of data-driven decision-making cannot be overstated. Power BI dashboard examples serve as powerful tools to distill complex data into digestible insights, aiding businesses in their quest for success. Whether it’s sales, marketing, finance, human resources, supply chain, customer experience, project management, healthcare, e-commerce, or social media analytics, these ten Power BI dashboards exemplify the versatility and impact this data visualization tool offers. Embracing the potential of Power BI in 2023 will undoubtedly empower businesses to make informed decisions, unlock new opportunities, and stay ahead in an ever-evolving marketplace. So, harness the power of Power BI, unlock your data’s true potential, and let your business thrive in the data-driven era of 2023 and beyond.


